
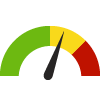
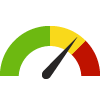
Indicator Gauge Icon Legend
Legend Colors
Red is bad, green is good, blue is not statistically different/neutral.
Compared to Distribution
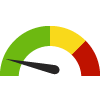 the value is in the best half of communities.
 the value is in the 2nd worst quarter of communities.
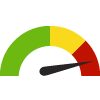 the value is in the worst quarter of communities.
Compared to Target
 meets target;
  does not meet target.
Compared to a Single Value
 lower than the comparison value;
 higher than the comparison value;
 not statistically different from comparison value.
Trend

 non-significant change over time;
 significant change over time;
  no change over time.
Compared to Prior Value
 higher than the previous measurement period;
 lower than the previous measurement period;
 no statistically different change from previous measurement period.
 Significantly better than the overall value
 Significantly worse than the overall value
 No significant difference with the overall value
 No data on significance available
Adults who Smoke
This indicator is archived and is no longer being updated. Click to learn more
This indicator shows the percentage of adults who currently smoke cigarettes.
Why is this important?
Tobacco is the agent most responsible for avoidable illness and death in America today. According to the Centers for Disease Control and Prevention, tobacco use brings premature death to almost half a million Americans each year, and it contributes to profound disability and pain in many others. The World Health Organization states that approximately one-third of all tobacco users in this country will die prematurely because of their dependence on tobacco. Areas with a high smoking prevalence will also have greater exposure to secondhand smoke for non-smokers, which can cause or exacerbate a wide range of adverse health effects such as cancer, respiratory infections, and asthma.
This is a Healthy People 2030 Leading Health Indicator.
The Healthy People 2030 national health target is to reduce current cigarette smoking in adults to 6.1 percent.
19.8%
Source:
CDC - PLACES
Measurement period: 2021
Maintained by: Conduent Healthy Communities Institute
Last update: September 2023
Measurement period: 2021
Maintained by: Conduent Healthy Communities Institute
Last update: September 2023
Filter(s) for this location: State: Indiana
Compared to

Technical note: Sub-county small area estimates use state and county data from the CDC's Behavioral Risk Factor Surveillance System (BRFSS) in tandem with demographic data for census tracts and cities. It is not appropriate to use this data for evaluation purposes.
More details:
Graph Selections

View maps, graphs, and tables for this indicator by selecting other location types (above).
Data Source
- CDC - PLACES
Note: This source uses Zip Code Tabulation Areas (ZCTAs) for its Zip Code data. Learn more
Maintained By: Conduent Healthy Communities Institute (Methodology)
Filed under: Health / Tobacco Use, Health / Respiratory Diseases, Health Behaviors, Adults